sokolova.dk
How to start the essay task at the Studieprøven exam
Elena Sokolova, June 2nd 2020
In this blog post, you will learn about the rule of the first 30 minutes for the Writing task (Skriftlig fremstilling) in the written part of the Studieprøven exam. This rule will help you to complete the Writing task in the rest 2,5 hours. The three hours of the Writing task fly during the exam! Proper planning and understanding of the task questions and even data titles can save time for writing a coherent text on the topic.
Describing data is a compulsory part of any Writing task of the Studieprøven exam
For the Writing task (let us call it further an essay), you receive an exam set with three structurally similar tasks but given on three different topics. You can choose between the three tasks, depending on what topic seems more comfortable to write about or familiar to you. So you only should write one essay on the topic you choose during three hours. However, no matter which of the three topics you choose, the first assignemnt element of the task is to describe the main features of the data set (let us call it further task questions):
Punkt 1: Gør ud fra faktainformationen kort rede for … .
The data material is usually given in a graphical representation (a table, a diagram, a figure or a pie-chart) about a specific process, a social or an economic issue, or a social trend over a period time. The data description part is usually the first ‘real’ paragraph of the essay after an optional short introduction (Introduction is not compulsory and is not on the list of the assessment criteria). You can find an example of the previous year’s exam set here: Studieprøven, November-December 2019.
Why describing data is the most predictable part of the essay?
I noticed from my teaching practice that describing data in general and statistical data, in particular, often creates obstacles the first time you try to write a trial exam essay. Some students even think it’s the most challenging part of the Writing task. However, it is the part of the essay to which you can be best prepared, regardless of which topic the Writing task will have. Moreover, you can learn the most useful terms, preposition phrases before the exam, and have them ready in your head on the big day!
If you face difficulties in getting ideas about what to write on the chosen topic, think of the data material as a source for ideas. Data description will help you organize your thoughts in the following paragraphs, where you, for instance, should write about the reasons and consequences of the given issue development over some time.
How much to write?
Since the whole essay should be a minimum of 400 words, the data description part of the essay should be around 80-100 words and not more. Considering this length, you only need to choose the main points from the data information.
The rule of the first 15 minutes
To write a coherent essay, you need to understand the context of the Writing task in whole and how the data set correlates with the title of the task. In this way, the data description will not stand as a paragraph without connection to the other questions in the task. Here is the plan for the first 15 minutes of your Writing task.
-
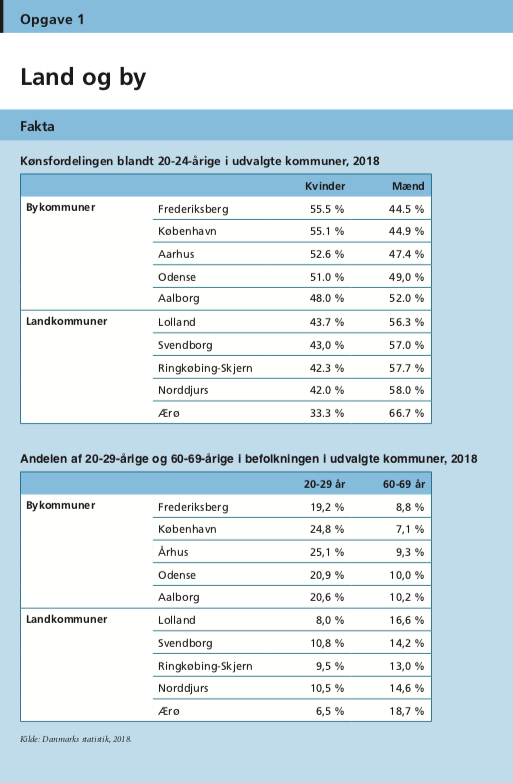
Read the explanatory sentences under the data material and make sure that you have understood them before looking at the data set. They often contain food for thought and hints towards what to pick up for data description. In other words, they cast the light on the issue and give the contextual and non-statistical summary of the issue. The explanatory sentences may look like this in Opgave 1 ‘Land og By’ from winter 2019:
Explanatory sentences:
Den igangværende urbanisering har i flere år været genstand for en del debat. Man har især diskuteret det bekymrende i, at der hos den yngre del af befolkningen er en udtalt bevægelse fra landdistrikterne ind mod byerne. Denne udvikling har konsekvenser for befolkningens alderssammensætning i henholdsvis land og by, og da det især er de unge kvinder, der vælger at flytte til byerne, har den også konsekvenser for kønsfordelingen blandt de unge. Spørgsmålet er, hvad denne tendens vil betyde på lidt længere sigt.
-
Make sure you have understood all the words and terms in the explanatory sentences. Look the unknown words up in the Danish-Danish dictionary with definitions, if in doubt. Try even to translate the sentences to your native language, to make sure you’ve understood them. If you can also interpret them with your own words, then you have understood them!
-
Read the four questions in the task description before you look at the data or visually analyze them. It will already help you to look at the data set afterwards with the perspective of what you should write about in these four questions. The questions for the task can be as follows (e.g. from Opgave 1 ‘Land og By’ from winter 2019):
1. Gør ud fra faktainformationen kort rede for kønsfordelingen blandt unge mænd og kvinder i de udvalgte kommuner samt for aldersgrupperne 20-29-årige og 60-69-åriges andele af kommunernes befolkning.
2. Hvad kan årsagerne være til den udvikling, som faktainformationen viser?
3. Hvad mener du, der kan gøre landkommunerne mere attraktive for de unge?
4. Tag stilling til udsagnet: ”Mændene bliver tabere i kampen om de gode jobs!” (Besvarelsen af dette punkt skal udgøre mindst 25 % af den samlede besvarelse).
Du skal skrive minimum 400 ord.
-
Correlate the four task questions with the title of the data set. The data (a table, a diagram, a figure, a graph ect.) usually has a title.
-
Find out where the data comes from. Does the information come from an interview (et interview), research, a survey or analytical article (en undersøgelse, en analyse, en artikel) in a scientific journal or a newspaper (en tidsskrift/en avis) or is it an authority’s report (en rapport udgivet af et ministerium/en styrelse).
-
Pick up 3-5 features from the data set, which are significant.
By correlating the explanatory sentences, the questions in the task, and the title of the data set with the main features of the data, you’ll already form an ‘idea summary’ of your text.
How to choose data features for description
Choose the features in the data material, which can work as reference points, when you later get to explaining the reasons of an issue or a trend development from data set, and can predict the consequences of the issue or suggest a solution to the problem/issue - in question 2 and 3 of the task.
Your first task question is to describe the most significant points/features in the statistics, so do not describe all the percentage levels for every single year or every single percentage for each group or each question/comparison variable as a long list. Instead unite similar rates and find regularities and systematics in the data, according to given comparison parameters or variables: for instance, unite data features by age, gender, income, education level as if you were making mini conclusions.
You can choose from three to five main points from the data set, depending on their significance. For example: describe the main trends in the development during the whole given period: the highest, the middle and the lowest rates precisely e.g., in percentage, number, amount; the difference in the percentage, for each or focus year/category of comparison/each or several united groups of population in the survey (e.g., groups by gender or location). Using mathematical precision to show that you understand data, formulate these trends in terms of an increase (en stigning på 5%; the corresponding verb is: at stige/steg/er steget med 5%) vs. a decrease (et fald på 5%; at falde/faldt/er faldet med 5%); a growth (en vækst) vs. a fall/drop(et fald).
Choose other features, which you can describe in general words, or approximately with less mathematical precision as a trend over time or a given period, using terms like ‘change’. It can be a prediction (en fremskrivning) or a measured level over a past period.
Choose the features that show distinct differences or similarities in the population groups or geographical regions. By selecting different trends, you can show you master different linguistic means, such as f.x. not always sticking to the percentage, but also telling about the global changes and development and correlations or interdependencies across them. Linguistic variety, precise and nuanced word choice is one of the assessment criteria for the Writing Task.
Take an example and look at the Studieprøven’s Writing set from November-December 2019 and try to plan the first paragraph in the first 15 minutes (before you start writing), in other words choose data for description.
Explanatory sentences
Problematikkerne omkring kriminalitet og straf bliver jævnligt taget op i medierne, og de har været anledning til mange politiske diskussioner, marketing og initiativer. Nogle mener dog, at debatten om kriminalitet og straf er meget unuanceret og skaber unødig bekymring i befolkning.
Opgave
- Gør ud fra faktainformationen kort rede for udviklingen i befolkningens opfattelse af antallet af straffe- lovsovertrædelser samt for antallet af anmeldte straffelovsovertrædelser i perioden 2011-2015.
- Hvad kan årsagerne være til de forskelle, som faktainformationen viser?
- Hvordan mener du, folks bekymring for kriminalitet vil udvikle sig i fremtiden?
- Tag stilling til udsagnet: ”Vi bruger for mange ressourcer på overvågning og straf!” (Besvarelsen af dette punkt skal udgøre mindst 25 % af den samlede besvarelse).
Du skal skrive minimum 400 ord.
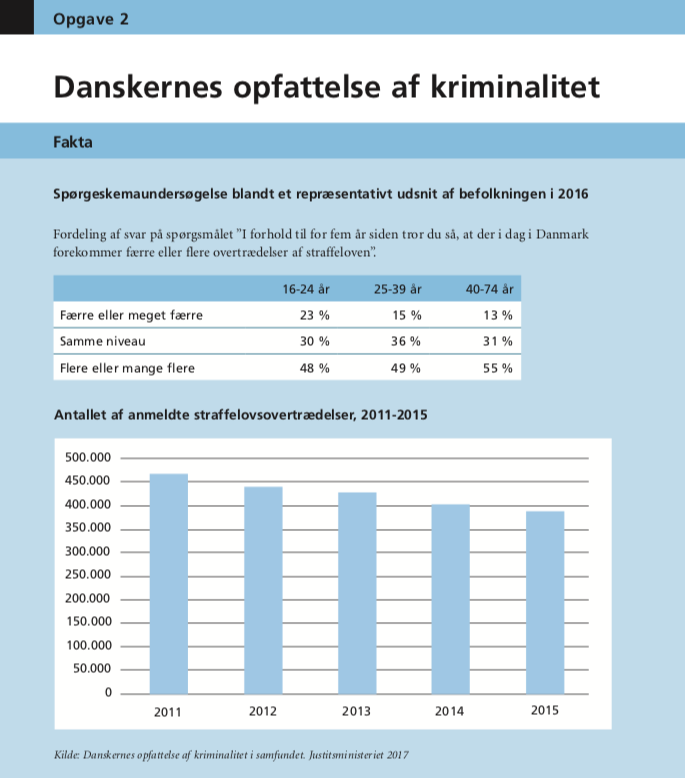
During the first 15 minutes, it is possible to conclude from the explanatory sentences and data material the following.
-
Almost half of the population in the survey across the three age groups believes that there has been committed more crimes over the last five years, that is why the crime rate increased in general.
-
The participants of the survey have impressions that do not correspond to the official statistics on the number of crimes, as shown in the diagram, published in the report by the Ministry of Justice in 2017. So this deviation is the second main feature you can choose to describe.
-
You may also extend on the deviation point, and say what the real crime rate is.
-
Another significant feature in the data, is that the age does not play a massive role on the impression in the groups, who overestimate the crime rate or believe, that the rate remained the same. However, there are significantly more young people, who believe that the crime rate has fallen over the five years (Think already about the reasons, why people judge so?).
The rule of next 15 minutes
Now that you have chosen the data for description, sketch ideas for the next 3 questions of the task in the form of keywords. Use arrows and bullets to organise your ideas on a draft paper. Choose 2–3 reasons with examples for the trends, you have chosen from in the data, while planning question 2 of the essay task. For question three connect them with 2–3 consequences of the issue or a trend development or (depending on the task questions) choose 2–3 suggestions to solve the problem. Mind, that the third question may differ from topic to topic in the exam set. For question 4 you will need to decide, whether you agree with the given citation or opinion, so include you attitude in the plan sketch, so that you know in advance, that your first three logical parts of the essay do not contradict to you own attitude in the last part of the essay. It is easy to avoid self-contradiction, when you decide what you think about the issue in advance, but not in the middle of writing your text! Finally, formulate in a couple of keywords for the conclusion to make sure, you see the red line all the way through your text.
What was it all about?
In the first 15 minutes, you have
- understood the explanatory sentences under the data material;
- read the task questions;
- understood the title of the data set;
- visually analyzed the data set;
- correlated the explanatory sentences under the data material, the quetions in the task and the data title with the data material;
- chosen main features in the data material;
- decided what issue/trend, in general, the data material reflects.
In the next 15 minutes, you have sketched a plan of the whole essay with keywords for all the four questions in the task to logically interconnected them.
Now you are ready to start writing the first sentence!
Do you have questions, comments or suggestions - email to elena@sokolova.dk.